Overview
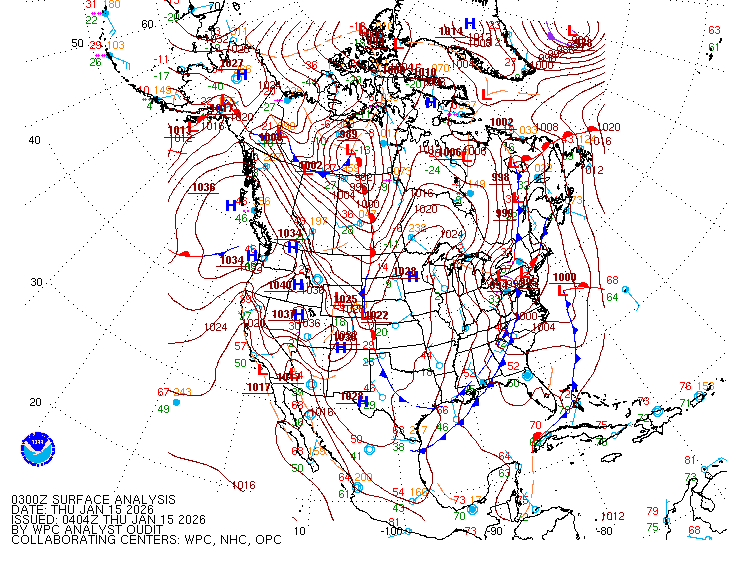
The surface analysis chart depicts an analysis of the current surface weather. This includes the areas of high and low pressure, fronts, and individual station plots.
The surface analysis chart is issued every 3 hours beginning at 0000 Z.
Examples
The most recent surface analysis chart is shown below. Use the last two links in the References list for full-resolution versions.
